Exercise
Exercise: Displaying Multiple Pages with Page Link
Please follow the below exercise to understand how to use the Page Link object.
Configuration
The following configuration is used to set up this exercise.
Page Configuration
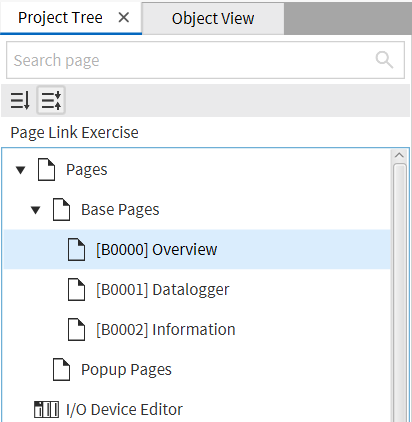
- Create the following pages under the Project Tree:
- Overview
- Datalogger
- Information
Tag Configuration
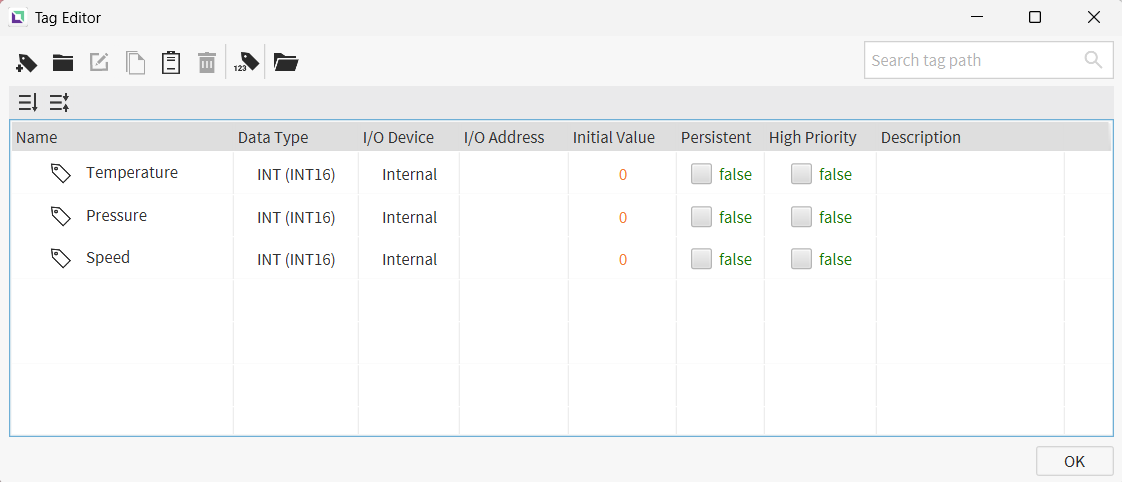
- Create the following tags:
- Temperature
- Data type: INT (INT16)
- Initial value: 0
- Pressure
- Data type: INT (INT16)
- Initial value: 0
- Speed
- Data type: INT (INT16)
- Initial value: 0
- Temperature
Data Logger Model Configuration
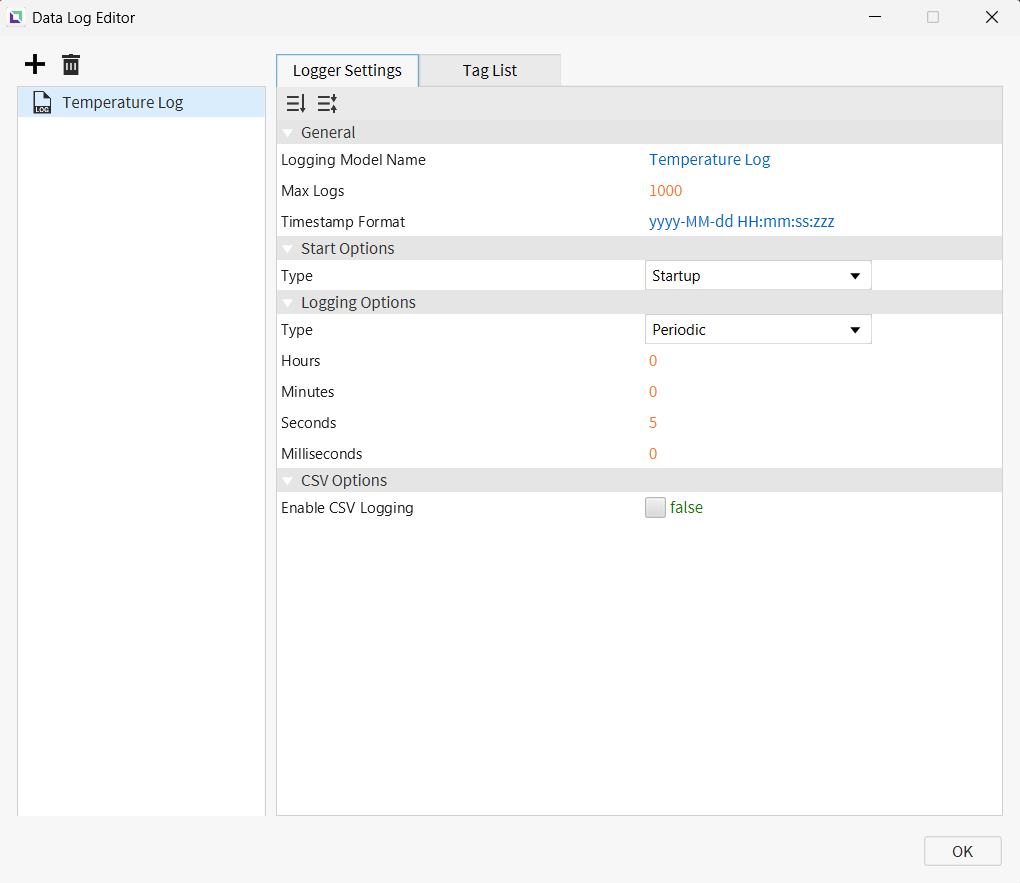
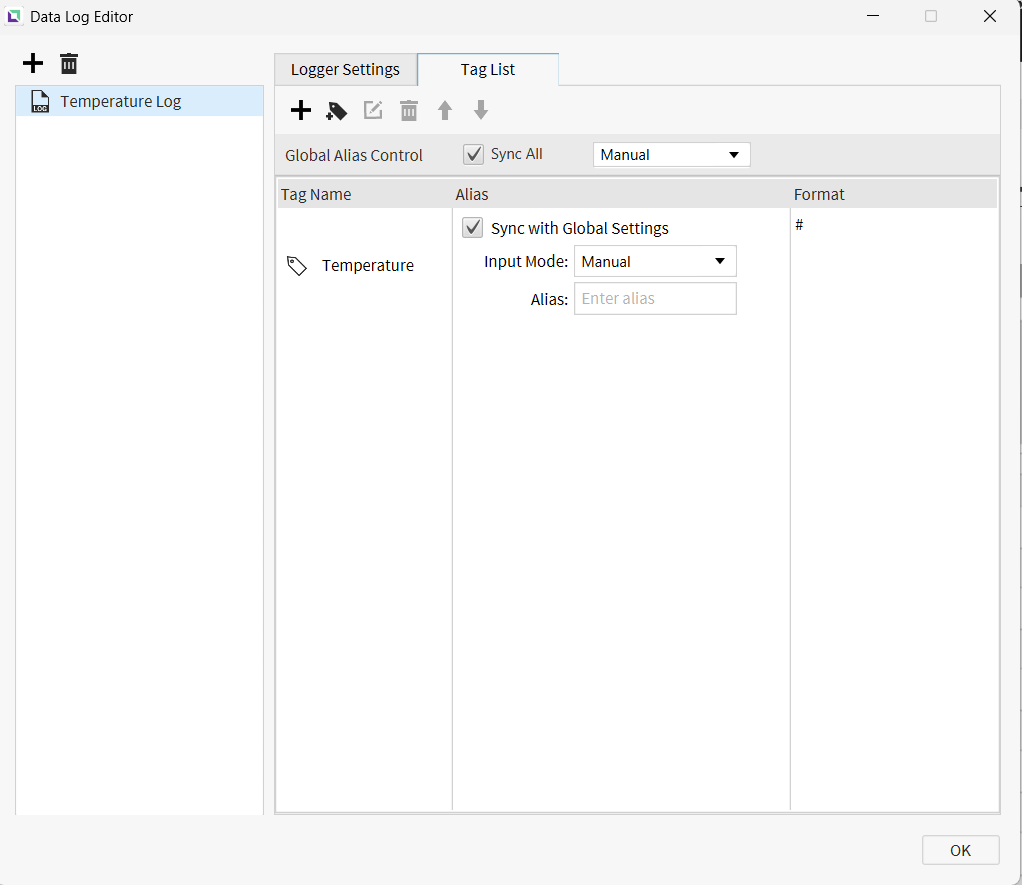
- Create the following data logger model under Tools > Data Log Editor:
- Temperature Log
- Logging Options: Periodic
- Hours: 0
- Minutes: 0
- Seconds: 5
- Milliseconds: 0
- Tag List: Temperature
- Logging Options: Periodic
- Temperature Log
Datalogger Page Configuration
-
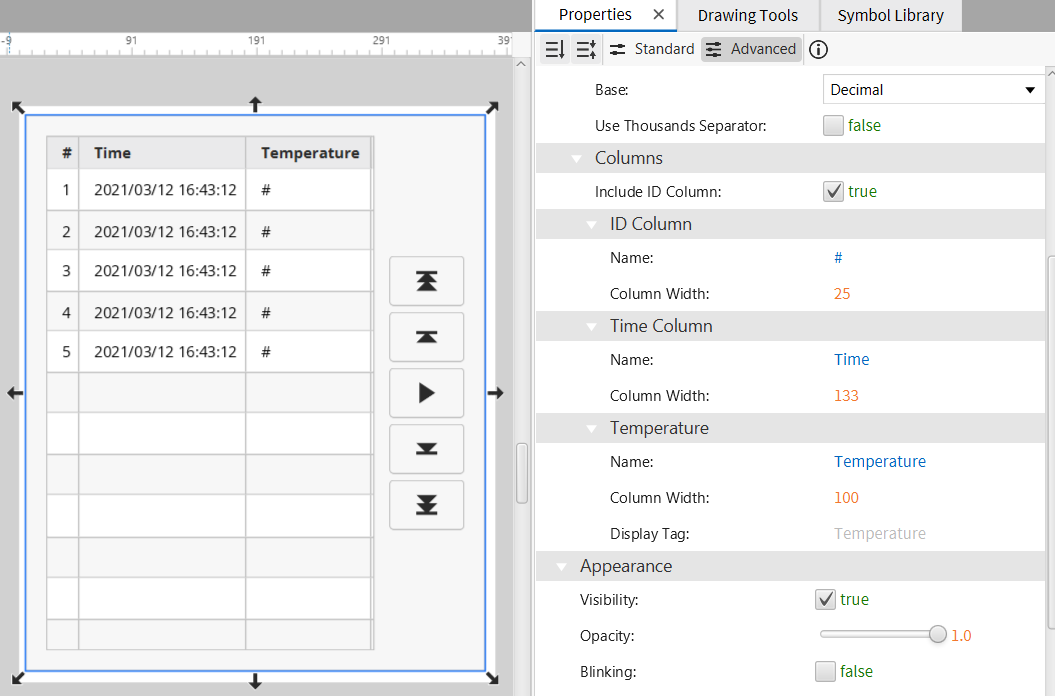
On the Datalogger page, go to Insert > Data Log Table or click the Insert Data Log Table icon on the toolbar.
Click and drag the Data Log Table to resize it, then set its data logger model to Temperature Log.
Information Page Configuration
-
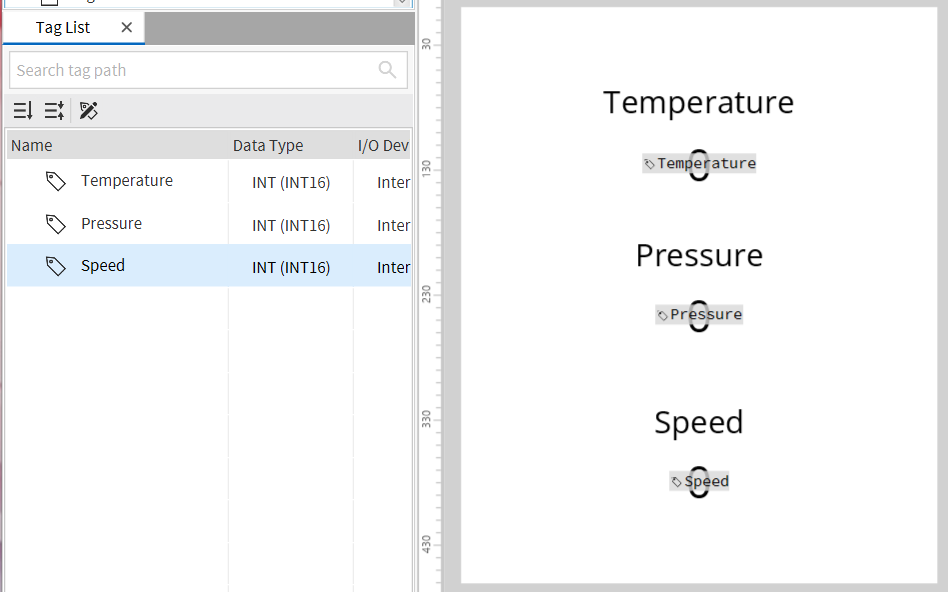
On the Information page, insert three Numeric Display objects.
Bind each Numeric Display's Value property to a tag: Temperature, Pressure, and Speed.
Page Link Configuration
-
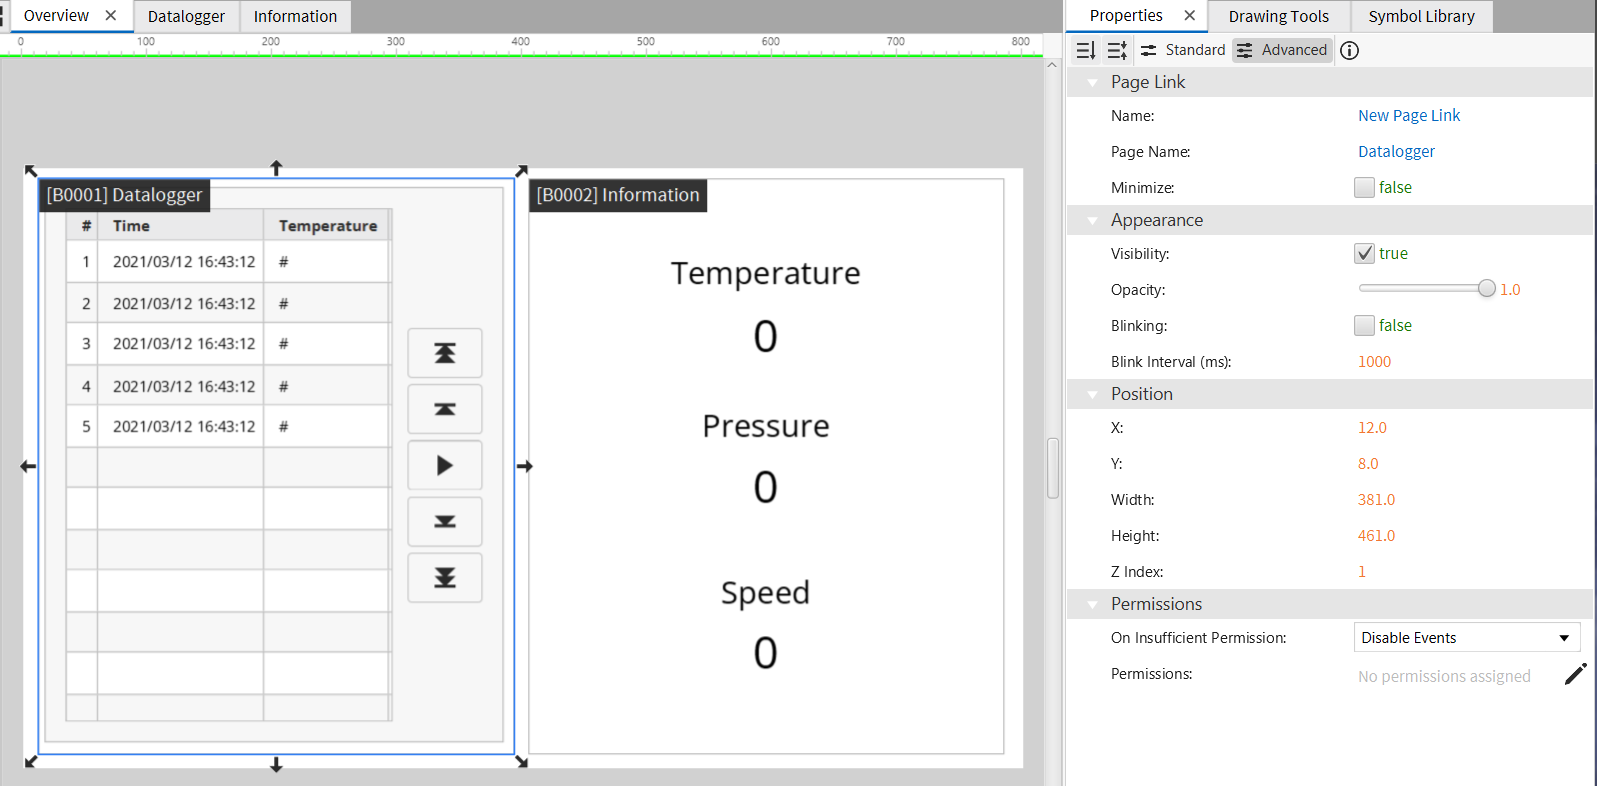
On the Overview page, go to Insert > Page Link, then click and drag to create the Page Link object.
Set the object's Page Name property to Datalogger.
-
Repeat the same steps for the Information page.
Set the object's Page Name property to Information.
Project Deployment
-
Click Tools > Launch Online Simulator to launch the Canvas Online Simulator.
-
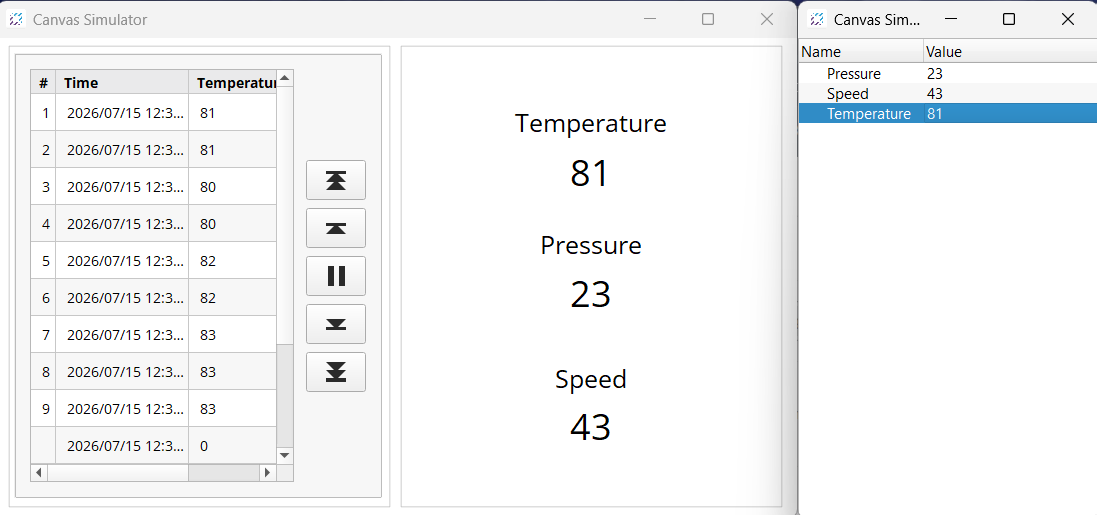
On the Overview page, confirm that the Datalogger page is displayed within the Page Link object, showing the logged Temperature values.
-
Also verify that the Information page displays all three values: Temperature, Pressure, and Speed.